
BLUF: Code got cheap, so engineering throughput — the thing we spent twenty years learning to measure — stopped being the scarce thing. This post is about what replaced it, and why your current dashboard can’t see it. Instrumenting it is the next post.
“Should we hire another frontend engineer or burn more tokens? Ship the feature or invest in CI/CD? Build the coding agent or buy one?”
Here are three calls I made this year that my dashboard couldn’t help with. Different budget lines, different time horizons, real money on each — and not one of my metrics had anything useful to say about any of them.
Even the new AI ones. I knew what felt wrong to measure. Tracking AI adoption defeats the purpose. Tokenmaxxing creates the wrong long-term incentives because it measures what you consumed (not what value you delivered). PR throughput on its own has never been enough.
And it wasn’t just the big investment calls. I realized this at every layer — problem selection to solution discovery, user research to production readiness, architectural correctness to organizational ownership. At every one of those layers: how do we know? How do we decide? How do we build this confidently — not just for day 0, but day 1000?
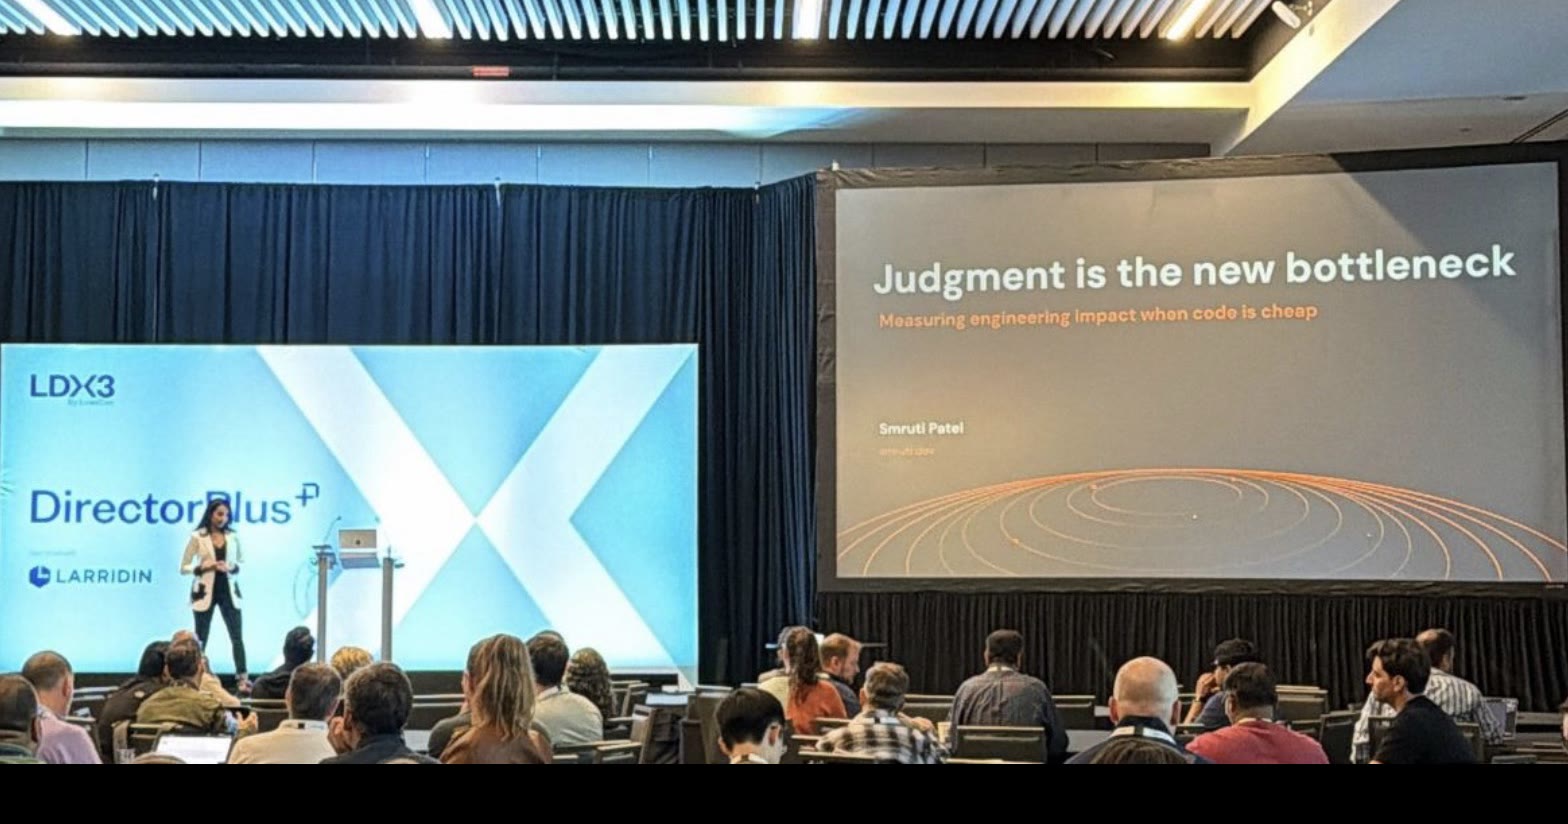
I gave the Director+ plenary workshop at LeadDev’s LDX3 in New York last week on exactly this. A room full of engineering leaders, and the diagnosis was unanimous before I finished the setup: we can’t tell the difference between motion and progress.
The proxies were right
Measuring engineering productivity and tying it to business impact was always hard. So the metrics we tracked have always been proxies.
We knew the crude proxies were crude — lines of code, story points, commit counts. So we built better proxies. And they were the right proxies for that time because the scarcest thing in that system was engineering time. DORA gave us the systems view: how work moves through the SDLC. SPACE gave us the human view: satisfaction, collaboration and flow.
Both also quietly assumed that output implied effort: ship more, and you’d worked harder or smarter. Speed was a proxy for something real. When engineering time was an expensive resource, it made sense to measure what we got out of it and where the flow got stuck.
Then code got cheap, and the proxy broke.
Three things I’ve heard this year
“Should we have shipped that alternate telemetry path? Customers wanted it, but the support burden crept up on us.”
“That little export button looked beautiful. Didn’t realize what a PII nightmare we’d just opened up.”
“Why did our multi-tenancy break? I didn’t even ship this feature.”
Three different teams, three different failure shapes. Three forces underneath them, and each one took an assumption with it.
Fast. The time to produce code is trending toward zero. Coding is no longer the bottleneck. With it went the assumption that output implies effort. Speed now tells you almost nothing about the engineer or the delivery system that produced the work.
Firehose. That output landed on systems never built to absorb it. Code review, CI, integration, on-call. Bottlenecks have shifted downstream.
LinearB’s 2026 benchmarks, drawn from 8.1M+ pull requests across 4,800+ organizations, put numbers on the pile-up: AI-assisted PRs wait 4.6x longer to get picked up, are reviewed twice as fast once someone does, and are accepted 32.7% of the time against 84.4% for human-authored ones.
A quick review that ends in rejection two times out of three is triage. The cost of cheap code has moved into review, and it lands on your most experienced people. Under that load, the third that gets through got the same quick look as the rest.
So shipped implies vetted went too. A green check means the tests passed. It doesn’t tell you whether anyone with the right context actually looked. Quality is under more strain now.
Earlier this year one of my senior engineers had to review a 30,000-line PR that had obviously been vibe-coded. That is not a review. That is a formality with a person’s name on it. It’s also anti-agile: we spent years teaching teams to work in small batches, ship incrementally, and keep the blast radius small. The default agent workflow does the opposite: hundreds of lines to complete a task that needed three commits.
Stakes went up. Agents amplify both the strengths and dysfunctions in your organization, so every decision now travels faster and further than it used to. The good ones and the bad ones alike.
One engineer with an agent can now ship what used to take a team. A decision that used to take a quarter, with a design review and a security review and three people who would have asked one good question at the right time, now takes an afternoon.
That takes the last one with it: you could trace an outcome back to a decision. Too much is in flight, and the signal arrives long after the call.
The assumptions our previous proxies relied on are all gone. What’s left is a dashboard that can’t tell a good decision from a fast one.
The data has the same shape. DX tracked PR throughput across 400+ companies over 5+ quarters: AI tool usage up 65%, median PR throughput up just under 8%. LeadDev’s AI Impact Report 2026 found 57% of leaders say token usage is ineffective at gauging real value, and 68% name the lack of clear metrics as their single biggest AI challenge. Different studies, different samples, one story: we’re generating more and understanding less.
One engineering leader described their org burning six figures in tokens against a CEO mandate to “use more AI,” and shipping nothing customers noticed. That is expensive theater: higher token spend, same impact they’d have had without it. The problem isn’t adoption. It’s that we’re still measuring the cheap thing.
The thing that’s actually scarce now is judgment.
Velocity is speed and direction
Back at Stripe, when I was leading Data Platform, the key constraint was engineering time. I wrote about this in Debugging Engineering Velocity. My thesis was that velocity is essentially speed and direction.
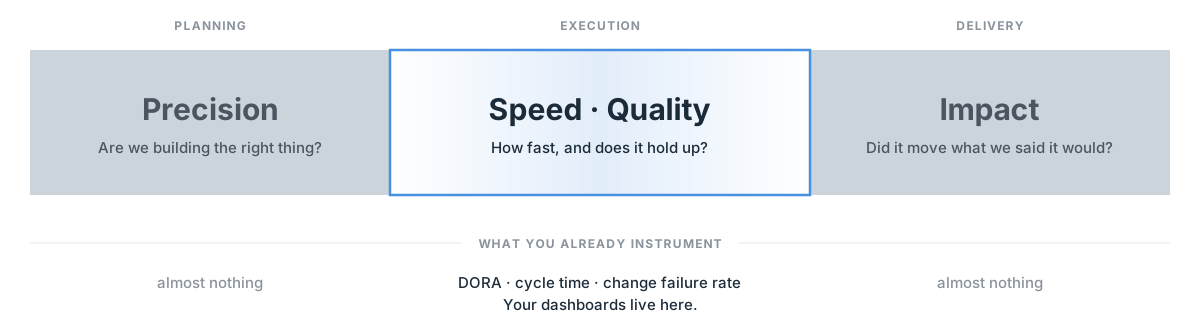
I use four lenses for it. Precision — are you building the right thing. Speed — how fast an idea reaches production. Quality — does it hold up. Impact — did it move what you said it would. Speed and Quality are the magnitude, how fast and how well you’re moving. Precision and Impact are the direction — whether you’re pointed at the right thing, and whether you got there.
Lay those over the delivery lifecycle and something jumps out. Precision is planning, Speed and Quality sit in the middle — execution — and Impact is delivery. The middle is where every instrument we own already points. DORA lives there. Your dashboards live there. That stretch of the pipeline is well-lit, because that’s where the pain used to be, back when engineering time was the expensive thing.
One of my teams at Stripe shipped on time and at quality, and was still quietly regarded as a body shop — engineers you could borrow for grunt work. No delivery dashboard would have caught that. What fixed it was a written charter with explicit boundaries about what the team would take on. Speed and quality were fine the whole time. Precision had drifted.
Precision and Impact sit at the two ends: the decision at the front, the consequence at the back. Those are precisely the two that got harder when code got cheap, and the two almost nobody instruments. Our pipelines are well-lit in the middle and dark at both ends.
Every metric is an instruction
Your dashboard is telling your organization what to optimize for — and people optimize for it, whether or not it’s the thing that matters. Measure adoption and you’ll get adoption: engineers using AI to move a usage number, and you still won’t know whether a single customer is better off. The metric you pick isn’t a readout. It’s a set of marching orders.
Which is why the hard part comes later: retiring a metric when its stage has passed.
Every metric made sense the day someone added it; the trouble is nobody takes them back off, so dashboards accrete, and an organization ends up carrying instructions it issued three strategies ago. I’ve never seen a team fight about adding a metric. I’ve also never seen one with a ritual for removing them.
Which of these four — Precision, Speed, Quality, Impact — matters most keeps shifting as an org matures. Early on you’re starved for Speed, so you may have purchased coding agents. If your organization is still establishing whether AI output can be trusted, Quality is the right obsession. Once you’re past that, focus on the bookends. Reaching for outcome metrics before your org can trust its inputs just produces a different flavor of noise.
That’s the mistake I made. We kept a review-coverage metric on the dashboard for three quarters after we’d stopped worrying about whether the output could be trusted. All green, every month, telling us nothing. The metric wasn’t wrong. Its stage had passed, and I didn’t retire it.
Precision is the quietest — did you even pick the right problem? — and Impact is the slowest, arriving quarters after the decision that caused it. Neither shows up on a velocity chart.
Code got cheap. Judgment got expensive.
Judgment was never optional — deciding which review to automate, which PRs to let through, when quality is good enough has always taken judgment. But that judgment is mature; we have decades of tooling and instinct for the middle of the pipeline.
What shifted is where the scarce, high-leverage judgment now sits. I stopped reaching for the dashboard on those three calls — every one was really a question about precision or impact: am I pointed at the right thing, and will I know if it landed? Those are the two ends the dashboard never lit.
The same forces that moved the bottleneck also hand us a way to see it. The throughput that created the firehose can also mine the corpus, connect a decision at the front to its consequence at the back, break the silos that kept precision and impact in separate rooms. For the first time, we can instrument the parts of the pipeline that were always dark.
The expensive thing moved; it moved toward the part that was always ours. Our core craft.
So what do you actually put in those two columns? That’s the next post: Instrumenting the Dark Ends.
I run Judgment Is the New Bottleneck as a 90-minute working session with engineering leadership teams: your staff brings the dashboard they actually use and leaves with one metric retired and one signal added. If your org is drowning in AI output and can’t tell motion from progress, get in touch.
For the operational side of this, how to roll AI out across an organization without breaking things, see From Pilots to Production.